Hours report
The hours report at Reports → Hours shows how many hours your workers are delivering, how well shifts are being filled, and where demand is concentrated across clients and positions.
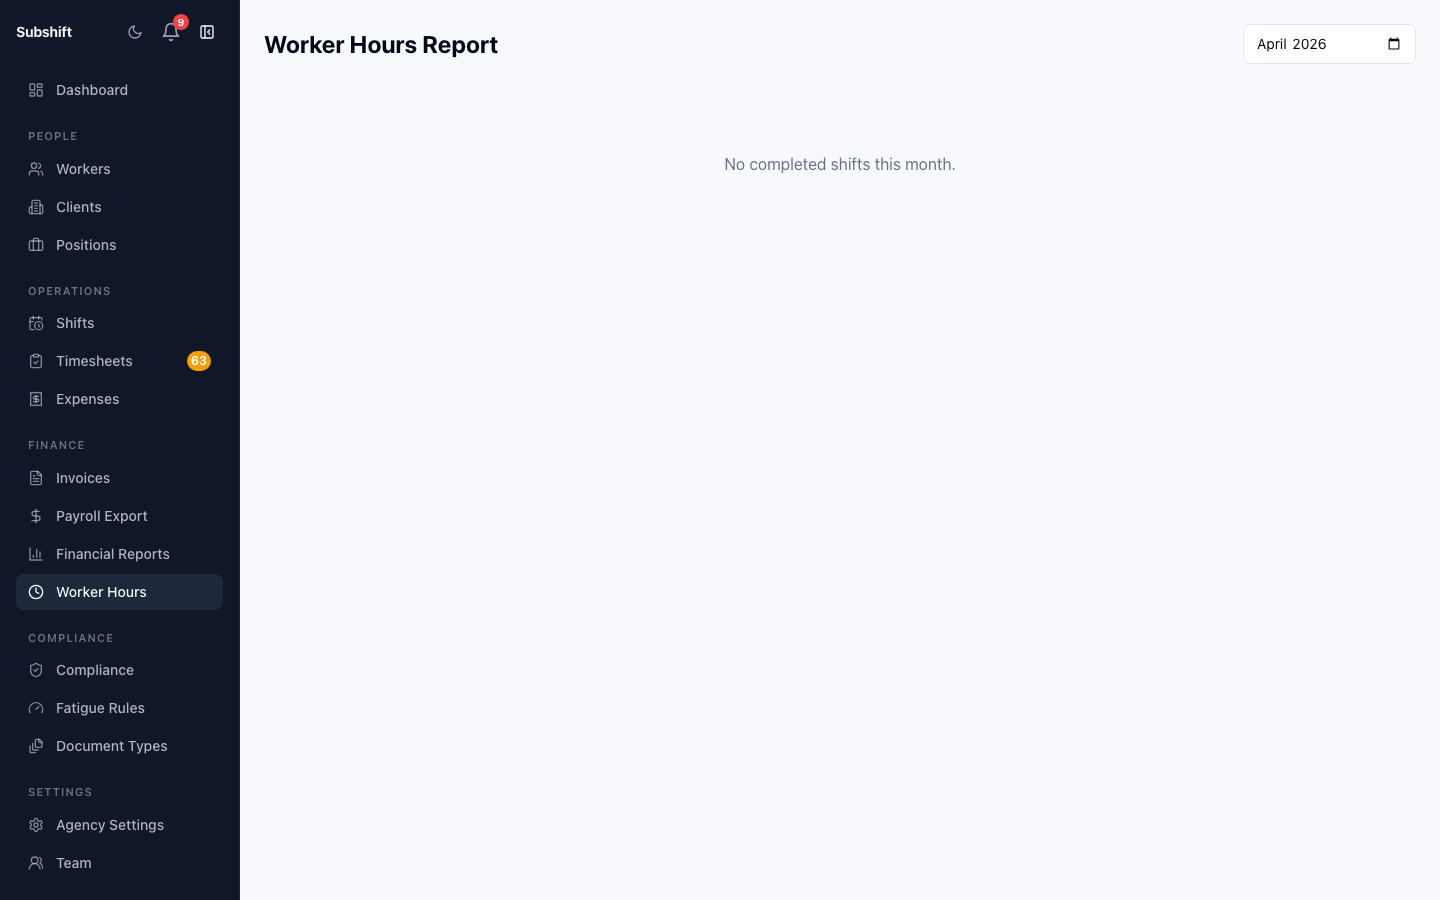
Opening the report
- Click Reports in the sidebar.
- Select Hours.
- Set your desired date range using the From / To date pickers.
Key metrics
- Total hours worked — the sum of all approved timesheet hours in the period.
- Shifts created — total shifts opened in the period, regardless of status.
- Shifts filled — shifts that reached FULLY_FILLED or PARTIALLY_FILLED status.
- Fill rate — the percentage of shifts that were at least partially filled. A fill rate below 80% may indicate a worker supply problem for certain positions or shifts.
Tip
If your fill rate is dropping, check the Workers list for positions with low headcount and consider recruiting or cross-qualifying existing workers.
Reading the charts
The chart panel shows hours broken down by the grouping you select — client, position, or month. Switch groupings using the selector above the chart. Hover over any bar or data point to see the exact figure.
Exporting
Click Export CSV to download the current view as a CSV file.
Note
Hours figures are based on approved timesheets only. Shifts in progress or with unapproved timesheets are not counted until the timesheet is approved.
Related
- Financial report — revenue and invoice tracking
- Workers overview — check worker availability and position coverage
- Timesheets — the source data for hours figures