Payroll report
The payroll report at Reports → Payroll summarises worker pay across completed payroll runs. Use it to review gross payroll costs for any given period and compare spend across positions or individual workers.
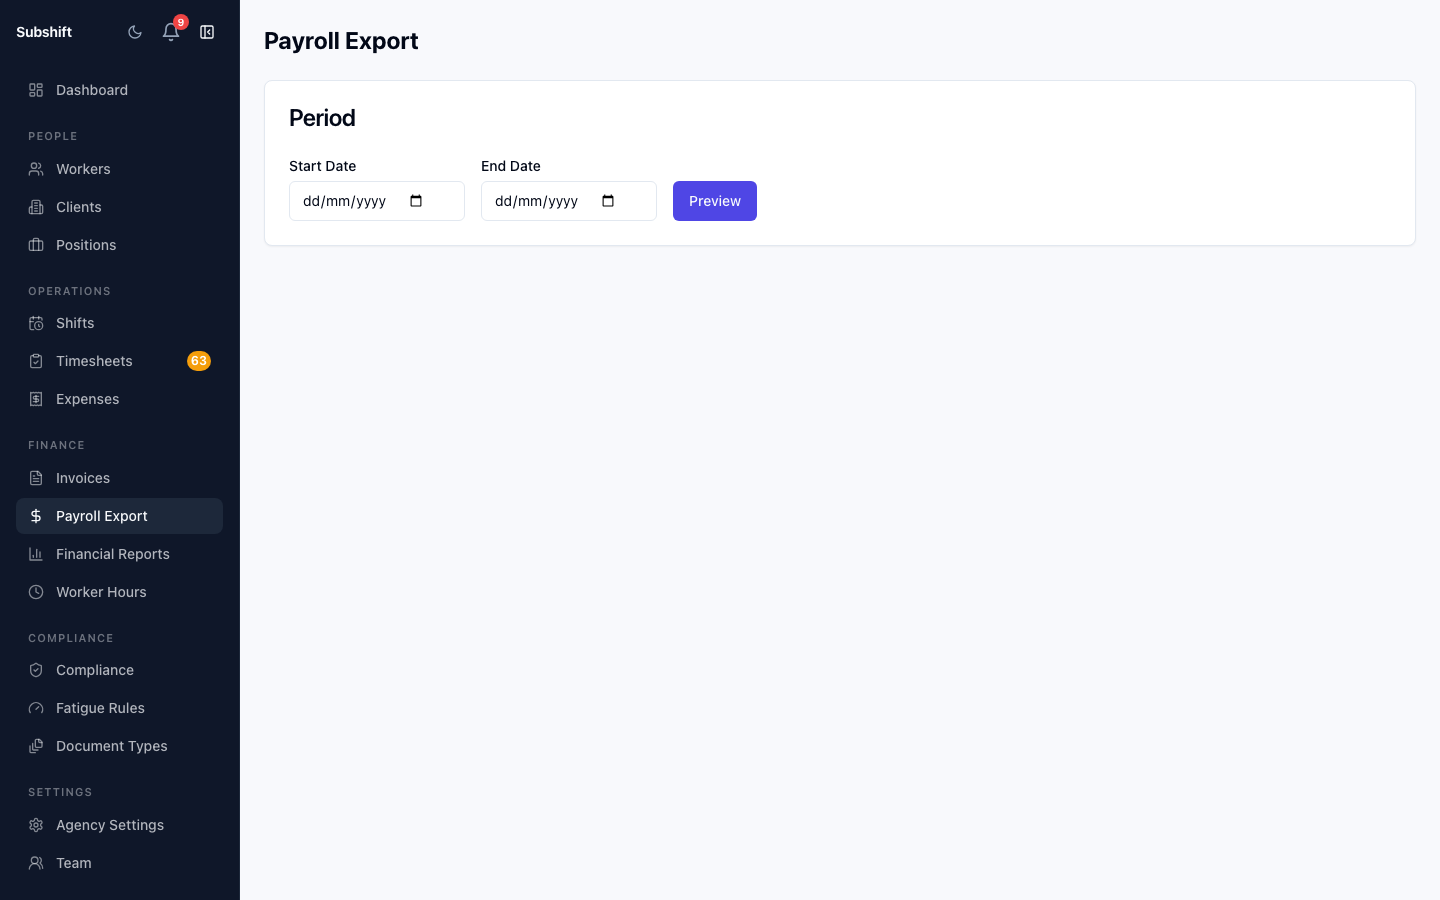
Opening the report
- Click Reports in the sidebar.
- Select Payroll.
- Choose a period using the date range controls.
Period summary
The summary at the top of the page shows:
- Total gross pay — sum of all worker payments in the selected period.
- Workers paid — number of unique workers included across all payroll runs in the period.
- Payroll runs — number of completed runs that contribute to the period total.
Breakdown table
The table below the summary shows one row per worker, with total hours, total shifts, and gross pay for the period. Click any worker row to drill down to the individual shifts that make up their pay.
Tip
Use the Group by position toggle to see which roles are driving the most payroll cost. This can help you identify positions where rate card adjustments might improve margin.
Comparing periods
The period comparison chart plots gross payroll month-by-month within your selected date range. This is useful for spotting seasonal peaks and planning headcount or capacity.
Related
- Processing payroll — run a payroll batch
- Payroll runs — view completed run history
- Financial report — revenue and margin overview